Diagram Prompt Vault — Editorial-Grade Diagram Prompts for ChatGPT, Claude & Gemini
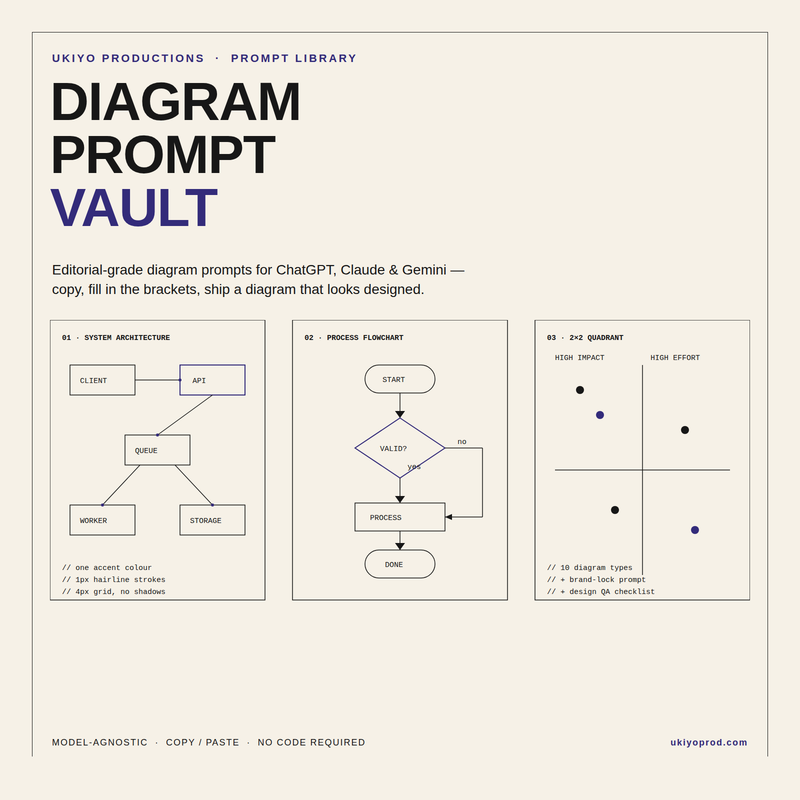
Diagram Prompt Vault is a library of ten original, copy/paste prompts — plus two supporting frameworks — for generating clean, on-brand, editorial-quality diagrams straight out of ChatGPT, Claude, ...
About This Product
Diagram Prompt Vault is a library of ten original, copy/paste prompts — plus two supporting frameworks — for generating clean, on-brand, editorial-quality diagrams straight out of ChatGPT, Claude, or Gemini's chat window. No IDE, no coding agent, no design tool required.
Why this exists
In August 2026, one of the fastest-rising repositories on GitHub is a diagram-generation skill built for coding agents like Claude Code — it auto-extracts a site's color palette and typography, then applies a strict editorial style (one accent color, hairline strokes, no shadows, grid-locked coordinates) across dozens of diagram types, so the output looks designed instead of AI-generated. It's a sharp idea, and it's MIT-licensed — but it only works if you're running a coding agent with file-system access and are comfortable installing a skill.
Most people who need a clean diagram aren't in that position. They're in a ChatGPT tab, a Claude Project, or a Gemini chat, and what they get back is the generic rounded-box, drop-shadow, gradient-everything diagram every LLM defaults to. Diagram Prompt Vault takes the same underlying design discipline — not any of the source project's code — and rebuilds it as plain-language prompts anyone can paste into a chat window and get an on-brand SVG or HTML diagram back, no local tooling involved.
What's inside
- 10 complete diagram-generation prompts, one per diagram type, each enforcing the same style discipline
- A Brand Palette & Type Lock prompt — run once per project, then reuse its output as a style header on every diagram prompt after it
- A Diagram Design QA Checklist — 6 checks to catch the "AI-generated" look before you ship a diagram
Best for
- Founders, PMs, and consultants who need a clean architecture, process, or roadmap diagram for a deck or doc and don't have a designer on call
- Technical writers and DevRel teams producing diagrams for documentation that has to match a house style
- Anyone who has pasted a diagram request into an LLM and gotten back a generic gradient-and-shadow mess that looks nothing like the rest of their site or deck
What you'll need
- Access to any capable chat LLM (ChatGPT, Claude, Gemini, or similar) — no plugins or file access required
- Your brand's accent color and font (or a screenshot/URL of your site — the Brand Lock prompt can work from either)
- The content that goes into the diagram: steps, components, roles, dates, or data points
- A place to render the output — the prompts request self-contained SVG or HTML, which opens directly in any browser
The Style Lock (use this first, once)
Paste this before your first diagram prompt in a session. It sets the design constraints every diagram prompt below assumes are already active — you only need to run it once per conversation.
Style Lock prompt:
"For every diagram you generate in this conversation, follow these constraints strictly: output a single self-contained SVG (or HTML with inline SVG) with no external dependencies except system fonts. Use exactly one accent color — [YOUR ACCENT COLOR, e.g. #2E2A6B] — plus black, white, and up to two neutral grays. All strokes are 1px hairlines; no drop shadows, no gradients, no bevels. Snap every coordinate to a 4px grid. Use one typeface family for all text, in no more than two weights. Labels are short — 1 to 3 words — and never overlap a line or shape. Leave generous whitespace; do not fill the canvas edge to edge. If any of this conflicts with a later instruction, ask before breaking it."
The 10 diagram prompts (copy/paste)
1. System Architecture Diagram
"Generate a system architecture diagram for: [DESCRIBE YOUR SYSTEM — components and how they connect, e.g. 'client app → API gateway → auth service + order service → shared Postgres database → background worker → S3 storage']. Represent each component as a labeled rectangle. Draw connections as straight or right-angle lines with a small dot at the join, not arrowheads, unless direction is genuinely ambiguous — then use a single small triangular arrowhead. Group tightly related components with extra spacing from unrelated ones rather than a visible boundary box, unless I've asked for explicit trust-boundary boxes."
2. Process Flowchart
"Generate a process flowchart for: [DESCRIBE THE PROCESS — steps and decision points, e.g. 'user submits form → validate → if invalid, return error and stop → if valid, process payment → send confirmation email → done']. Use rounded rectangles for start/end, sharp rectangles for process steps, and diamonds for decisions. Every decision diamond has exactly two labeled exits ('yes'/'no' or the real condition names). Keep the main path a single vertical line down the center; route exception branches to the side and back in, never crossing the main path."
3. Sequence / Message Flow Diagram
"Generate a sequence diagram for: [DESCRIBE THE PARTICIPANTS AND MESSAGES IN ORDER, e.g. 'Browser, API, Auth Service, Database — browser requests login, API calls Auth Service, Auth Service queries Database, response flows back']. List participants as evenly spaced vertical lifelines across the top. Draw each message as a horizontal arrow at the correct vertical position for its order in the sequence, labeled with the message name only — no payload detail unless I specify it. Use a solid arrow for a request and a dashed arrow for a response."
4. Org Chart / Reporting Hierarchy
"Generate an org chart for: [LIST ROLES AND WHO REPORTS TO WHOM]. Each box shows a role title only, no names, unless I provide names. Use a single line from the bottom-center of a manager's box to the top-center of each direct report's box; do not use elbow connectors unless more than 4 direct reports would otherwise overlap. Keep sibling boxes at identical width and vertical position within their tier."
5. Timeline / Roadmap
"Generate a horizontal timeline for: [LIST EVENTS OR MILESTONES WITH DATES OR PHASE NAMES]. Draw one horizontal baseline. Mark each milestone as a small filled circle on the line with its label and date alternating above and below the line to avoid crowding. Space milestones by actual date interval if dates are given, or evenly if only phase order is given — tell me which you used."
6. Comparison Matrix
"Generate a comparison grid for: [LIST THE OPTIONS BEING COMPARED AND THE CRITERIA]. Render as a clean grid with options as columns and criteria as rows. Mark each cell with a filled dot, hollow dot, or dash for yes/partial/no — never emoji checkmarks or colored cell fills. Bold the row label of any criterion I mark as a must-have."
7. 2×2 Positioning / Quadrant Map
"Generate a 2x2 quadrant map with x-axis '[LOW LABEL] → [HIGH LABEL]' and y-axis '[LOW LABEL] → [HIGH LABEL]'. Plot these items: [LIST ITEMS WITH THEIR APPROXIMATE POSITION OR THE DATA TO ESTIMATE IT FROM]. Use a filled dot for each item with its label placed beside it, never on top of the dot. If two items would land within 20px of each other, nudge one slightly and note that you did."
8. Funnel / Conversion Diagram
"Generate a funnel diagram for: [LIST STAGES IN ORDER WITH COUNTS OR PERCENTAGES IF KNOWN]. Draw each stage as a horizontal bar whose width is proportional to its value, stacked top to bottom, center-aligned. Label each bar with the stage name and its value or percentage. Show the drop-off between adjacent stages as a small annotation beside the connecting edge, not inside the bar."
9. State Machine / Status Flow
"Generate a state diagram for: [LIST STATES AND THE EVENTS/CONDITIONS THAT MOVE BETWEEN THEM]. Represent each state as a rounded rectangle. Label every transition arrow with the event or condition that triggers it — never leave an unlabeled transition. Mark the initial state with a small filled circle feeding into it and any terminal state with a double border."
10. Gantt-Style Project Schedule
"Generate a Gantt-style schedule for: [LIST TASKS WITH START/END DATES OR DURATIONS AND ANY DEPENDENCIES]. One horizontal bar per task, tasks stacked vertically in start-date order, positioned against a top axis of dates or week numbers. Draw a thin connecting line from the end of a task to the start of any task that depends on it. Mark today's date, if relevant, with a single vertical dashed line across all bars."
Supporting framework: Brand Palette & Type Lock
Run this once at the start of a new project to generate a reusable Style Lock line instead of guessing your own hex codes.
"Here is [MY BRAND'S SITE URL, A SCREENSHOT, OR A DESCRIPTION OF MY BRAND'S LOOK]. Identify: one primary accent color as a hex code, a neutral gray that pairs with it, and the general character of the typography (e.g. geometric sans, humanist sans, monospace-technical). Output this back to me as a single Style Lock sentence in the exact format: 'Use exactly one accent color — #______ — plus black, white, and one neutral gray #______. Typeface character: ______.' so I can paste it directly into the Style Lock prompt above."
Supporting framework: Diagram Design QA Checklist
Run any diagram output — from this library or anywhere else — through these 6 checks before you use it:
- Color count: Count distinct colors used, including tints. More than accent + black + white + 1 neutral gray means it drifted — ask for a redraw with the Style Lock restated.
- Shadow/gradient check: Any drop shadow, glow, or gradient fill present? These are the single biggest "AI-generated" tell — reject and regenerate.
- Label collision: Does any text overlap a line, shape edge, or another label? Flag every instance before use, not just the obvious ones.
- Alignment check: Do same-tier elements (sibling boxes, parallel bars, grid cells) actually line up, or are they off by a few pixels? Eyeball it against a straightedge if rendered.
- Whitespace check: Is anything touching the canvas edge, or does the diagram feel cramped? Ask for more breathing room around the outermost elements.
- Readability at scale: Would this still be legible shrunk to fit a slide thumbnail or a doc's inline width? If not, ask for fewer elements or larger label text before shipping.
How to use
- Run the Brand Palette & Type Lock prompt once (or just fill in your own hex code) to get your Style Lock line.
- Paste the Style Lock prompt into a new chat, with your accent color filled in.
- Pick the diagram prompt that matches what you need, fill in the bracketed content, and send it.
- Run the output through the Diagram Design QA Checklist before you use it anywhere real.
- Reuse the same Style Lock across every diagram in a project so they all match each other, not just your brand.
FAQ
Is this the diagram-generation skill I've seen trending on GitHub? No, and it doesn't contain any of that project's code. This library takes the same underlying design philosophy — one accent color, hairline strokes, no shadows, grid discipline — and rebuilds it as plain-language prompts for people using a chat LLM rather than a coding agent. It solves a related but different problem: no file-system access, no skill installation, no coding agent required.
Do I need Claude Code, Cursor, or any coding tool to use this? No. Every prompt here is designed to be pasted into a normal chat interface — ChatGPT, Claude.ai, Gemini, or any other chat LLM — and returns a self-contained SVG or HTML block you can open directly in a browser.
Is this affiliated with Anthropic, OpenAI, Google, or the original diagram-design project? No. This is an independent, model-agnostic prompt library and isn't affiliated with or endorsed by any AI lab or the creator of the project that inspired it.
Will this work with any model? Yes. The prompts are plain language with no platform-specific syntax. Output quality will vary by model — models stronger at following detailed formatting constraints will hold the style discipline more consistently across a long diagram.
What if the model still adds a gradient or shadow? Run the QA checklist, then reply with: "Redraw this following the Style Lock exactly — no gradients or shadows anywhere." Restating the constraint after seeing the drift usually fixes it in one turn.
What's Included
- Complete files ready to use
- Documentation and setup guide
- Free updates
- Commercial license
- Email support
Product Details
Benefits
Real data and metrics that show the value of investing in quality tools.
What Students Achieve
Skill Development Progress
Key Features
Ready to Use
Download and start using immediately. No complex setup required.
Fully Tested
Extensively tested to ensure reliability and performance.
Team Friendly
Works great for individuals and teams of any size.
Time Saver
Save hours of work with pre-built solutions.
Free Updates
Get access to all future updates at no extra cost.
Premium Quality
Built with best practices by industry experts.
Frequently Asked Questions
You'll receive instant access to download the Course. All files are provided in standard formats that work with the relevant platforms.
Yes! We offer a 14-day money-back guarantee. If you're not satisfied with your purchase, contact us for a full refund.
Absolutely! Your purchase includes a commercial license that allows you to use this product for unlimited personal and client projects.
No special software is required. We provide detailed setup instructions with your purchase.
Yes, we provide email support for all purchases. Premium members also get access to our private Discord community for faster help.
Get Unlimited Access
Join our membership and get this product plus 100+ more for one monthly price. Download everything, cancel anytime.